Debugging using the PlatformIO Debugger and the JTAG Debug Adapter
There are two primary methods to debug a program on OpenIMU.
- Use Visual Studio Code with ST-Link JTAG pod.
- Use the debug serial port to output debug messages.
1. Debugging Using Visual Studio Code and JTAG Debugger
Visual Studio Code with installed Aceinna extension supports in-system debugging via ST-LINK JTAG pod. It allows to load and run application, stop in any place of the code by using breakpoints, observe and set values of local and global variables, observe device memory contents. The following screen shots show Visual Studio Code screen in debug mode.
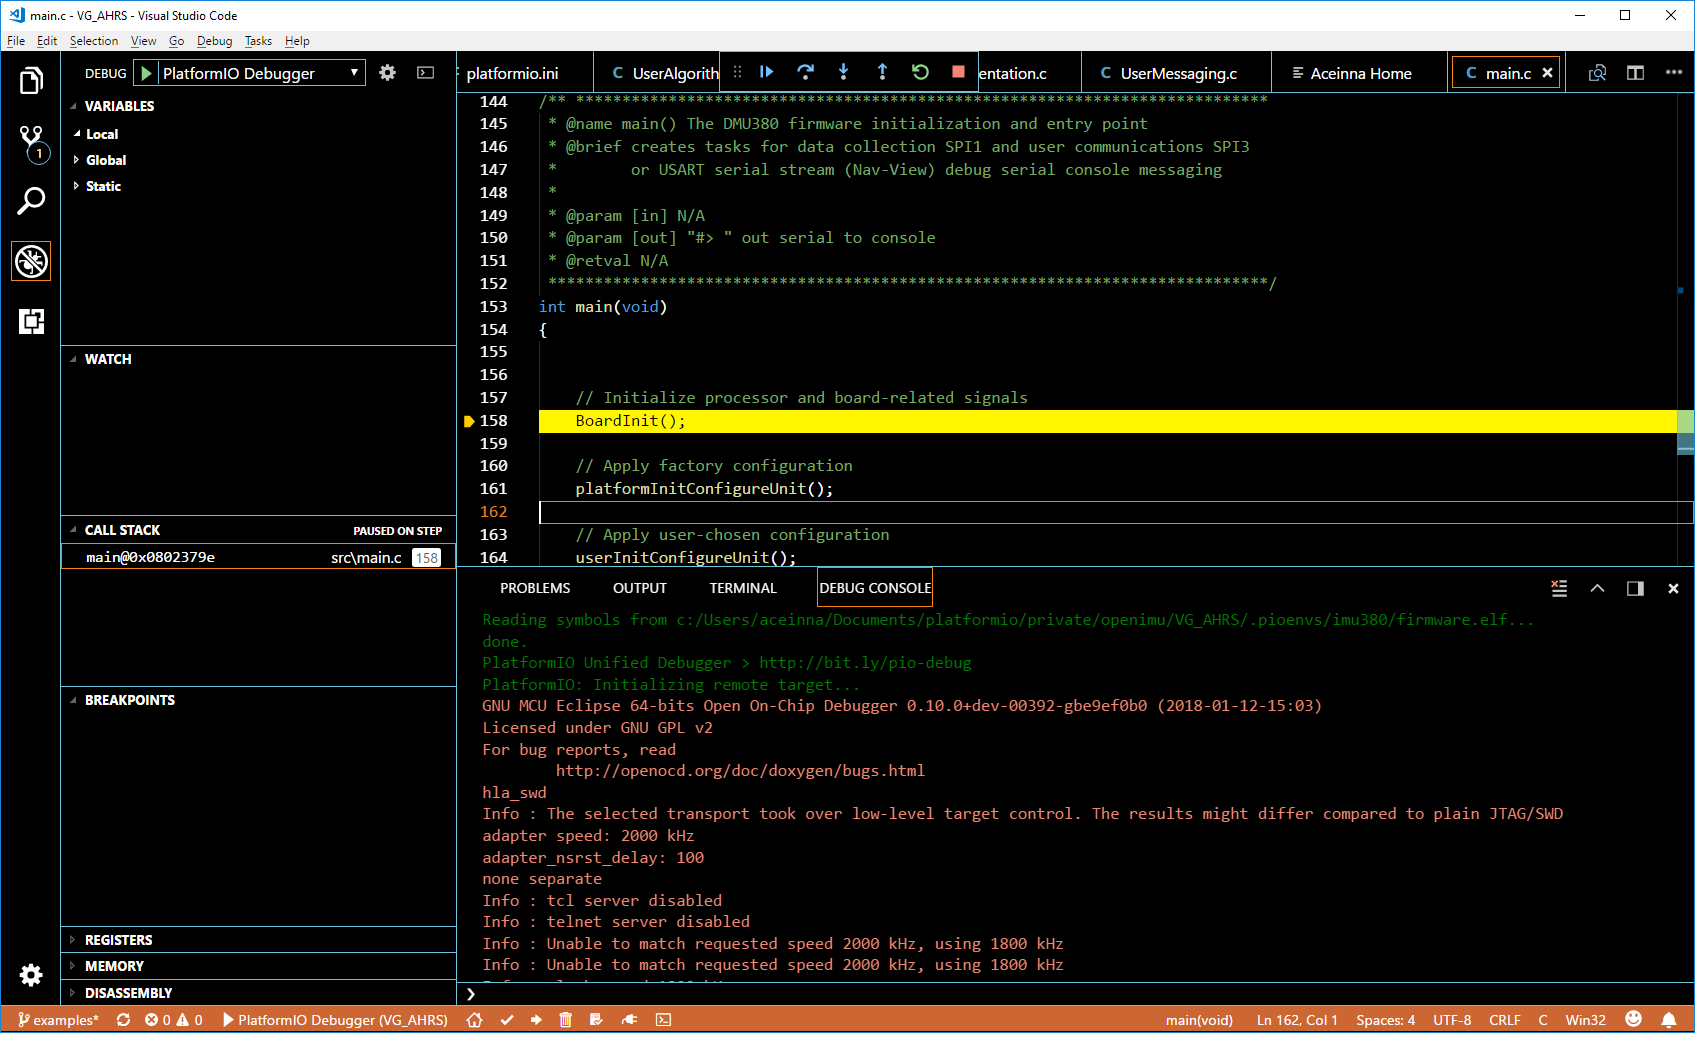
Debug mode can be entered by clicking on “Debug” icon - fourth from top on very left of the screen and then clicking on green arrow “PlatformIO debugger” on top of the screen or alternatively from the menu “Debug->Start Debugging”. After entering debug mode use debug control icons on top of the screen or commands from “Debug’ menu. After clicking “Debug” icon on the left of the screen while in debug mode allows to observe variables, memory, registers, call stack, etc.
2. Debugging Using Debug Serial Port
User defined ASCII messages can be sent out via debug serial connection. Default baud rate is 38.4 KBaud. One can easily change debug port baud rate in main.c file:
// Initialize the DEBUG USART (serial) port
InitDebugSerialCommunication(38400); // debug_usart.c
Custom printf-like syntax outputs ASCII data on debug serial port
int tprintf(char *format, ...);Alternative macros for outputting type-specific values defined in the debug.h file.
OpenIMU unit has built-in CLI which can be enabled by uncommenting next line in file platformio.ini :
-D CLI
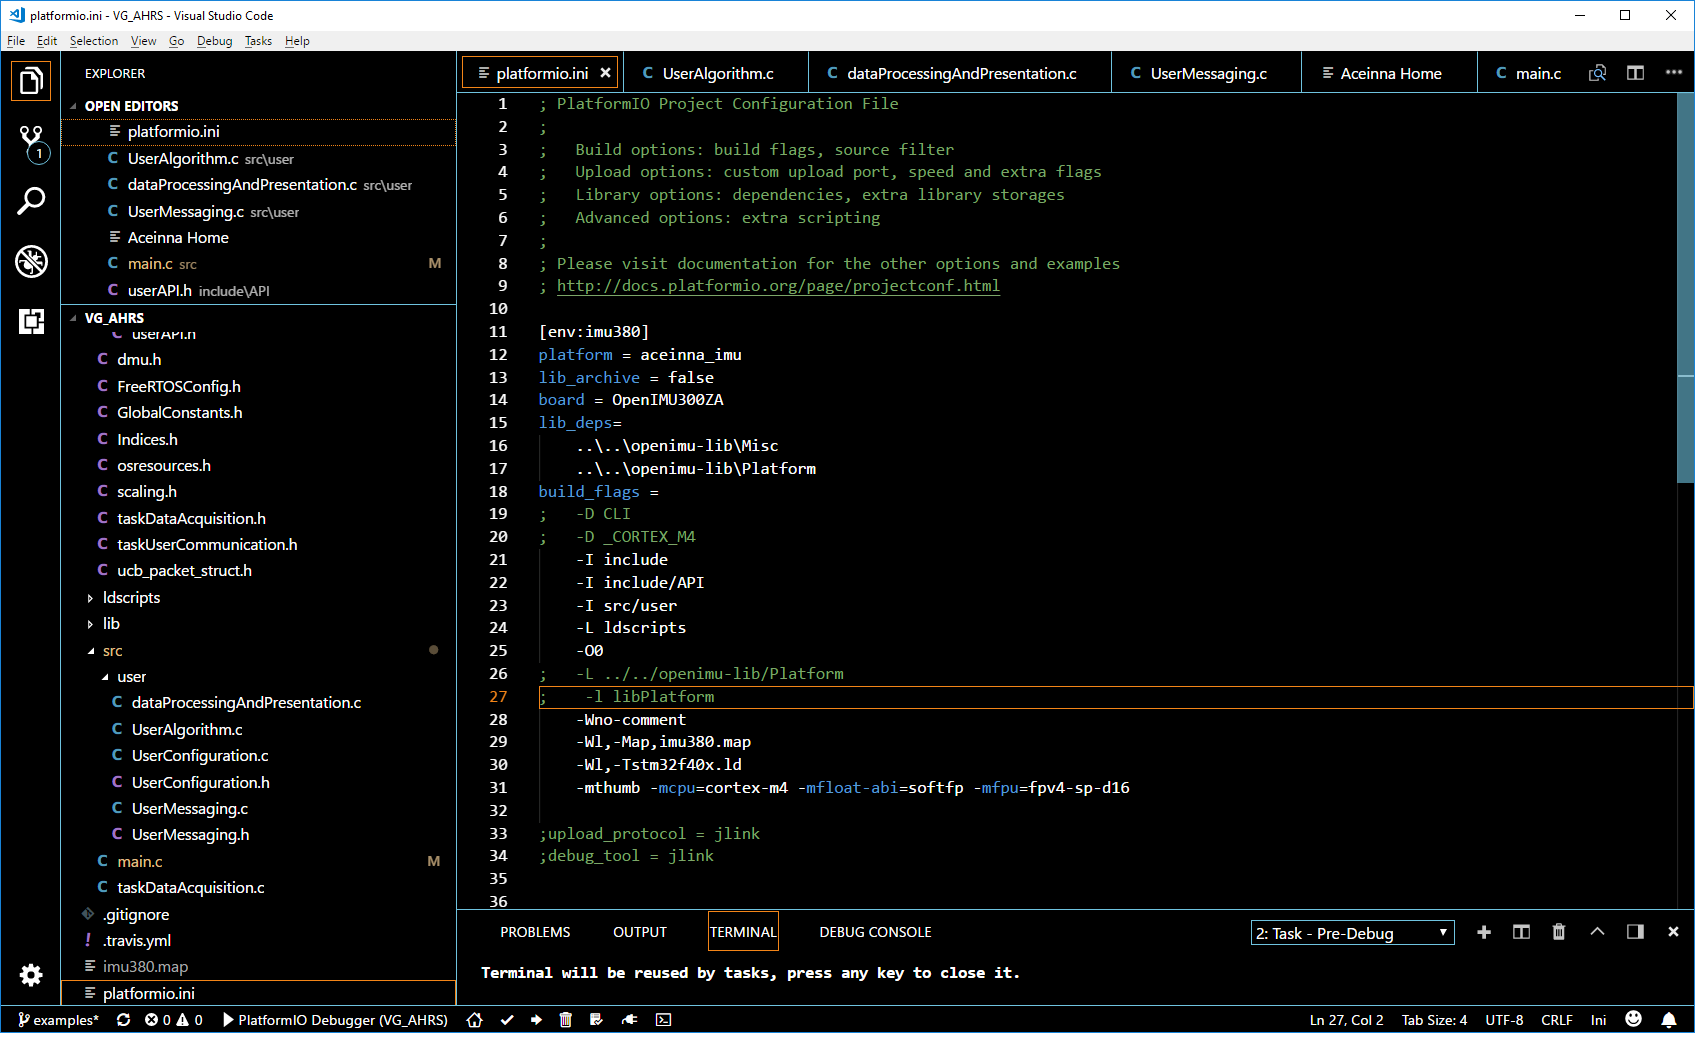
It allows to send custom ASCII commands to OpenIMU unit via debug serial port using any serial terminal program. CLI engine reside in CLI directory in libraries source tree. Please note that while unit connected to PC via USB port it is visible as four consecutive virtual serial ports. Third port in a row will be debug serial port.
Note
- The Acienna VSCode extension uses the underlying PlatformIO debugging feature.
- PlatformIO now provides free JTAG debugging for all users.
Note
Visual Studio Code with installed Aceinna extension provides download of application image into device memory via JTAG by clicking “Right Arrow” icon on the bottom of the screen. This is the fastest method to download code and generally requires just a few seconds.
Note
The documentation and tutorials on this site assume use of the ST-LINK JTAG pod. The JTAG pod is shipped with every OpenIMU developer’s kit.